Yusuf TiamiyuYusuf Tiamiyu
Lagos, Nigeria  ·  Healthcare data analyst

Yusuf
Tiamiyu

I’m a data analyst at Cerba Lancet Nigeria, a diagnostic lab network. I build the reporting that tells nine labs how long their results take to reach doctors, and why some arrive late.

50% → 70%+
TAT compliance across 9 labs
1 day → 2 min
Weekly report, after automation
20,000+
Lab records processed a week

About me

Dec 2024
Data analyst at Cerba Lancet
Jul 2025
Also Data Protection Officer
2023
Paper in Hydrology

I joined Cerba Lancet Nigeria as a data analyst in December 2024. Since July 2025 I’ve also been its Data Protection Officer, so part of my week is analysis and part is data protection: compliance audits across our sites, breach procedures, and training staff. The two jobs overlap, because most privacy questions are questions about where data goes and who can see it.

Most of my analysis is about turnaround time, the gap between a sample being booked in and its result being verified. When I started, the weekly TAT report took someone a full day in Excel and arrived a week late. I replaced it with a pipeline and a dashboard that supervisors now use on their daily calls. I also built the inventory tracker the labs use to reorder supplies, and the weekly operations dashboard managers use to compare sites.

I studied chemistry at Lagos State University. My final-year project, on groundwater quality across 25 wells, became a paper in Hydrology in 2023. Lab work taught me not to trust a result until I know how it was produced, which is most of data cleaning too.

Before analytics I worked in quality assurance at Flour Mills of Nigeria, where I noticed that shifts staffed only by new hires had the biggest weight deviations. The supervisor changed the roster so every shift had someone experienced on it. Outside work, I play a lot of video games.

Download resume ↓ Read the paper ↗

What I use

01
SQL
MySQL, SQL Server, Postgres
Window functionsRecursive CTEs Gaps and islandsData cleaning Quality checksRow-level security
02
Python and statistics
pandas, statsmodels, SciPy
Logistic regressionInterrupted time series Hypothesis testingmatplotlib JupyterETL scripts
03
Excel and Power BI
Daily reporting at work
Power QueryDAX Star schemasSUMIFS, INDEX/MATCH Pivot tablesDashboard design
04
Dashboards and apps
For people who aren’t analysts
ReactSupabase RechartsTableau FlaskNetlify, GitHub Pages
05
Domain
Healthcare operations and data protection
Lab turnaround timeKPI design Clinical research dataInventory planning NDPA complianceStaff training

Selected work

8 projects
01
In daily use
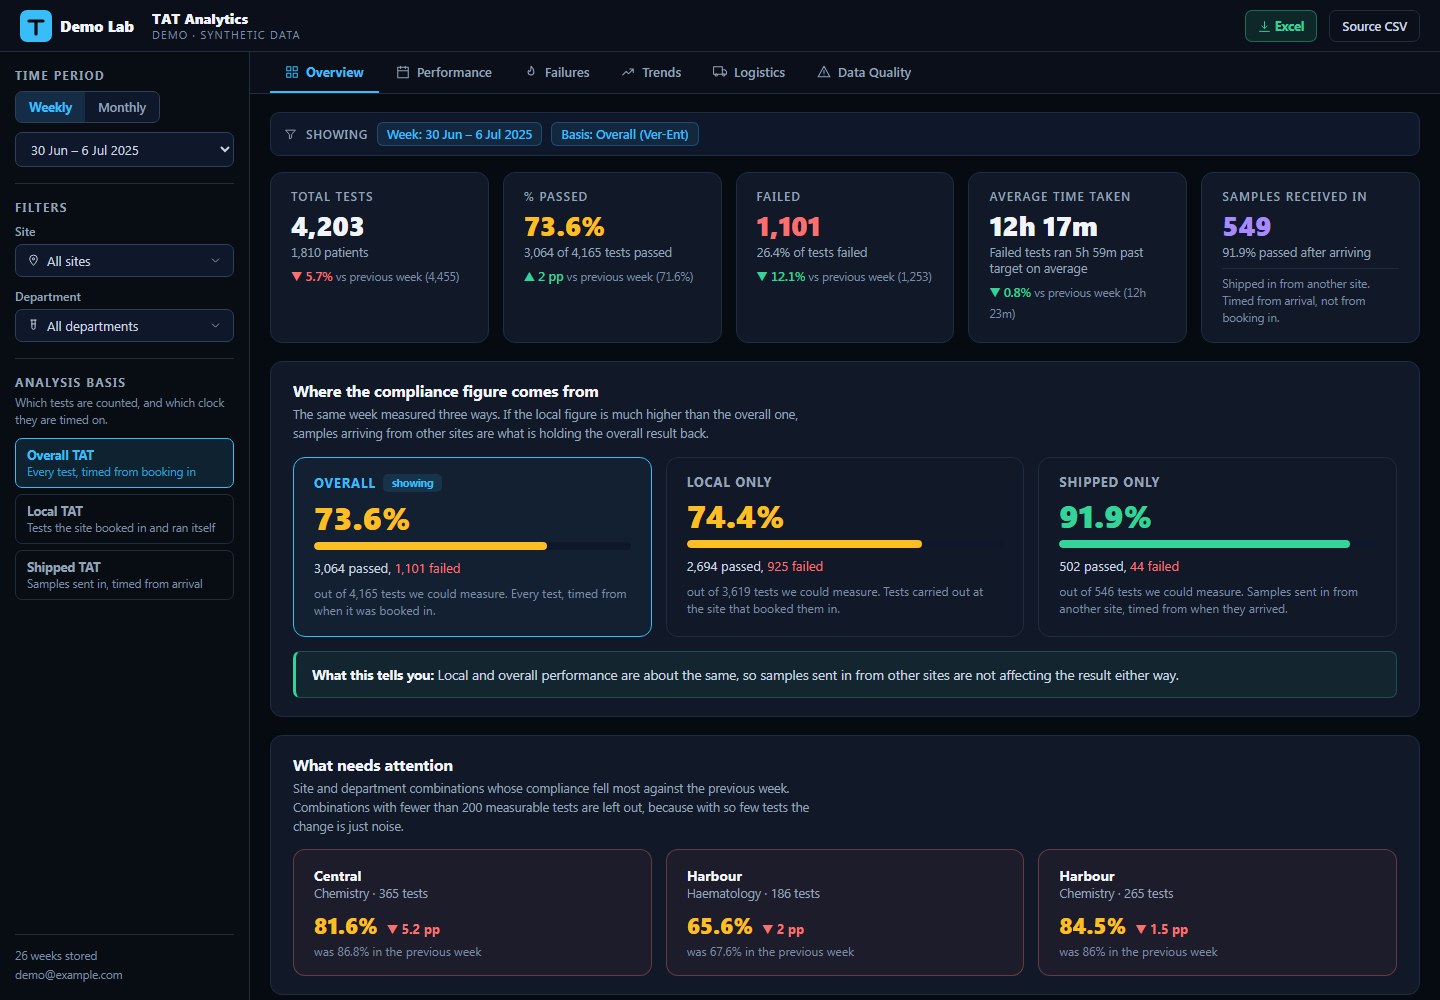
Overview tab of the TAT dashboard showing weekly compliance, failures and average turnaround time

Lab TAT analytics platform

The weekly turnaround report used to take a full day in Excel. I replaced it with an ETL that reads the LIS export and a React and Supabase dashboard used across nine lab sites. Compliance went from about 50% to over 70% once supervisors started using it on their daily calls. The public demo runs the production code on synthetic data.
ReactSupabase / PostgresRow-level securityHealthcare
02
Statistics
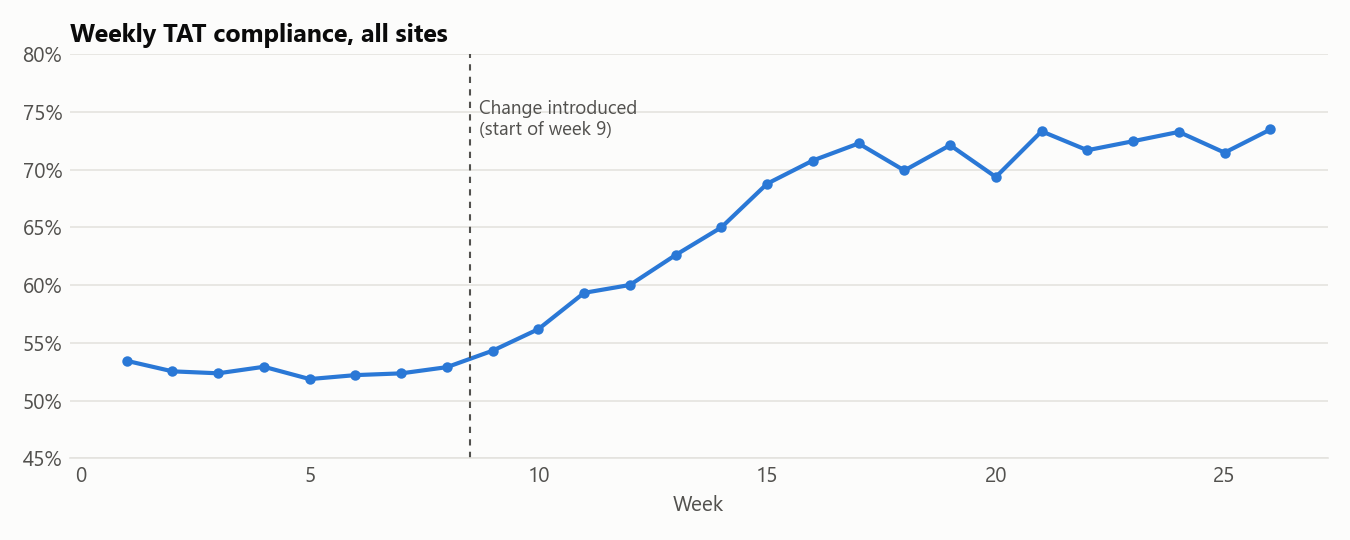
Line chart of weekly TAT compliance rising from 53% to 72% after a process change in week 9

What drives lab TAT breaches?

Logistic and segmented regression on 110,000 test records. Two short-staffed sites account for a quarter of all breaches, referred samples have 2.7 times the odds of running late, and a mid-period process change lifted compliance beyond the existing trend.

PythonstatsmodelspandasHealthcare
03
At work
Customer experience dashboard with automatic alerts, Net Promoter Score and satisfaction figures

Turning customer feedback into action

A pipeline that cleans customer survey responses every day, scores them, sorts comments into themes and builds a private callback list, plus a dashboard managers read without training. On demo data it shows slow urgent results drive most of the unhappiness, and that the form's own "complaints resolved" figure overstated the truth.

Node.jsPythonCustomer experience
04
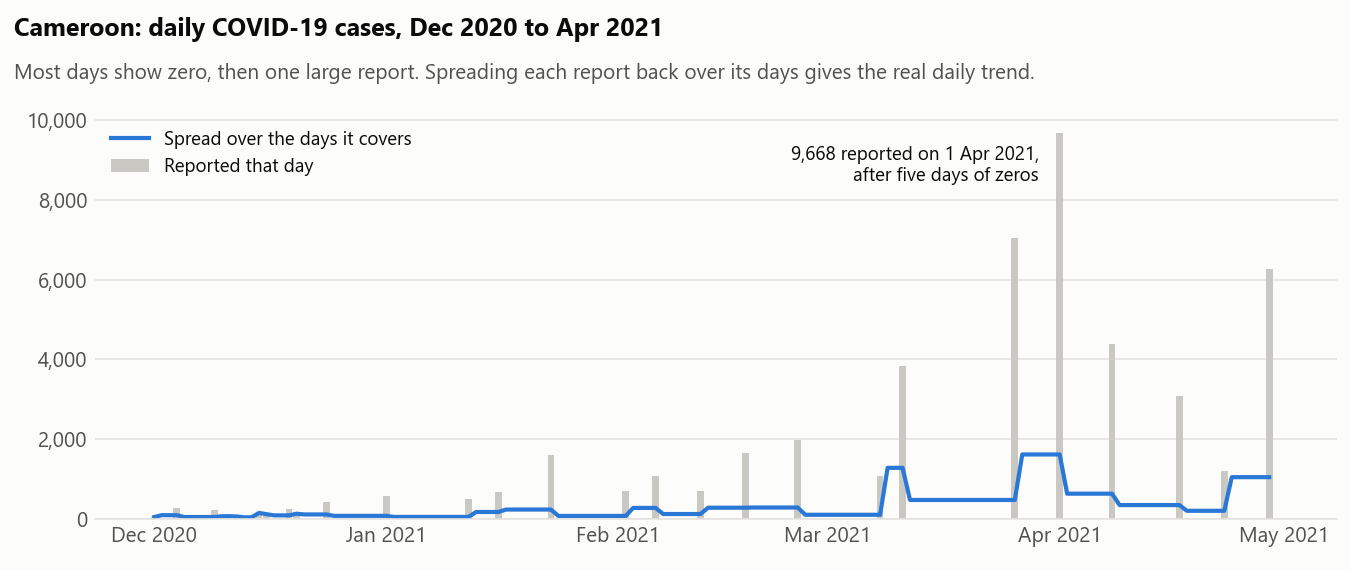
Cameroon's daily COVID cases: large single-day reports versus the same reports spread over the days they covered

How far can daily COVID numbers be trusted?

A MySQL data-quality study of 208 countries. Found 21 reporting in batches and spread each batch back over the days it covered, cutting day-to-day noise by up to 91%. Also measures the weekday effect and how thin testing inflates death rates.

MySQLRecursive CTEsGaps and islands
05
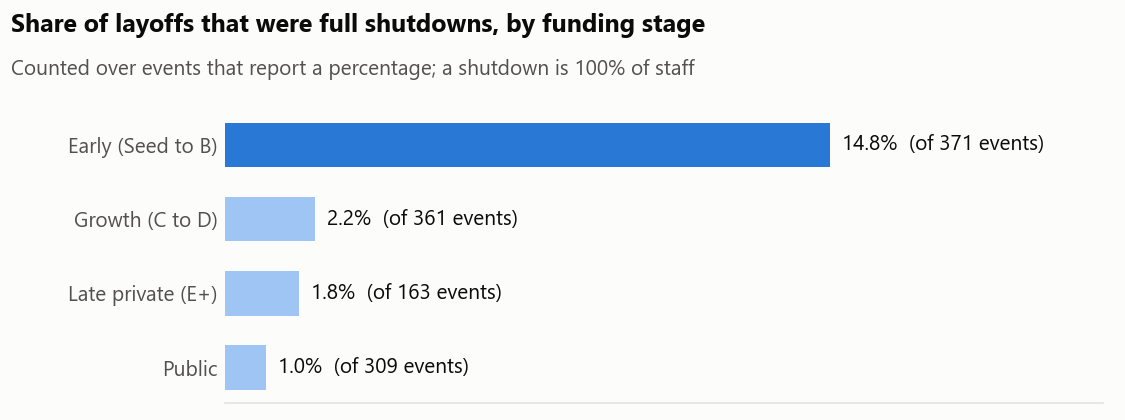
Bar chart: 14.8% of early-stage startup layoffs were full shutdowns, against 1 to 2% at later stages

Tech layoffs 2020–2023

Cleaned 2,361 layoff records in MySQL with every step logged and checked, then asked five questions. Early-stage startups were seven times more likely to shut down completely, and Retail cut the second-most jobs but the smallest share of its workforce.

MySQLWindow functionsData cleaning
06
At work

Lab operations dashboard

An Excel dashboard for lab managers covering tests, requisitions, TAT against target, staffing and analyser uptime across nine sites. One selections sheet drives every figure, and each KPI compares itself with the previous week. It showed that staffing gaps clustered at particular sites in particular weeks.

ExcelSUMIFSHealthcare
07
At work

Inventory reorder tracker

A tracker for 1,578 lab consumables and reagents that flags each item for reorder when two months of stock are left, using a separate issuance log as the audit trail. Procurement moved from ordering after stock ran out to ordering before.

ExcelINDEX/MATCHSupply chain
08
Guided

Excel and Tableau practice

Two projects I built from Alex Freeberg’s tutorials and then reframed around my own questions: which customers buy bikes (2–5 mile commuters convert best, at 58.6%), and what a new Seattle Airbnb host should know about pricing.

ExcelTableauGuided project
Showing all 8 projects All repositories on GitHub ↗

How I work

01
Start from the decision

Before I open the data I ask who will act on the answer and what they would do differently. For the TAT dashboard, that meant building it around what supervisors check on their daily operational calls.

02
Check the data before using it

I count rows against the source, look for duplicates and impossible values, and write the checks down so they run again next time. In the COVID project, Hong Kong was missing 316 days, which a simple group-by would never have shown.

03
Pick definitions I can defend

A test with no verification time is left out, not counted as a failure. Rates are calculated once, from counts. Choices like these decide whether two managers looking at the same week see the same number.

04
End with what to do

“Staff these two sites properly and about 139 breaches a week go away” is something a manager can plan around. I try to finish every analysis with a recommendation and an estimate of what it’s worth.

Get in touch

I’m looking for data analyst roles, especially in healthcare and operations. I’m based in Lagos and happy to work remotely.

✓
Message sent.
I'll get back to you shortly.
or reach me directly