Lab turnaround-time platform
A dashboard that shows nine labs, every day, which test results are running late and why.
The problem
Turnaround time (TAT) is how long it takes from a sample being booked in to its result being ready for the doctor. Every test has a target time.
Before this, someone downloaded the data from the lab system at the end of each week, cleaned it by hand in Excel and emailed it round. It took a full working day, and by the time anyone read it the problems were a week old. Nobody could see which department or shift the delays were coming from.
What I did
- Built a reference list of every test with its target time and department, so a delay could be traced to Chemistry or Haematology rather than just "Site X had a bad week".
- Automated the weekly cleaning, which cut the job from a day to about two minutes.
- Built a web dashboard that keeps every week’s results, so supervisors can compare weeks and months and drill into any site, department, test or shift.
- Made the numbers trustworthy: tests that can’t be measured are left out instead of being counted as failures, and each person only sees the data they should.
What I found
What supervisors see
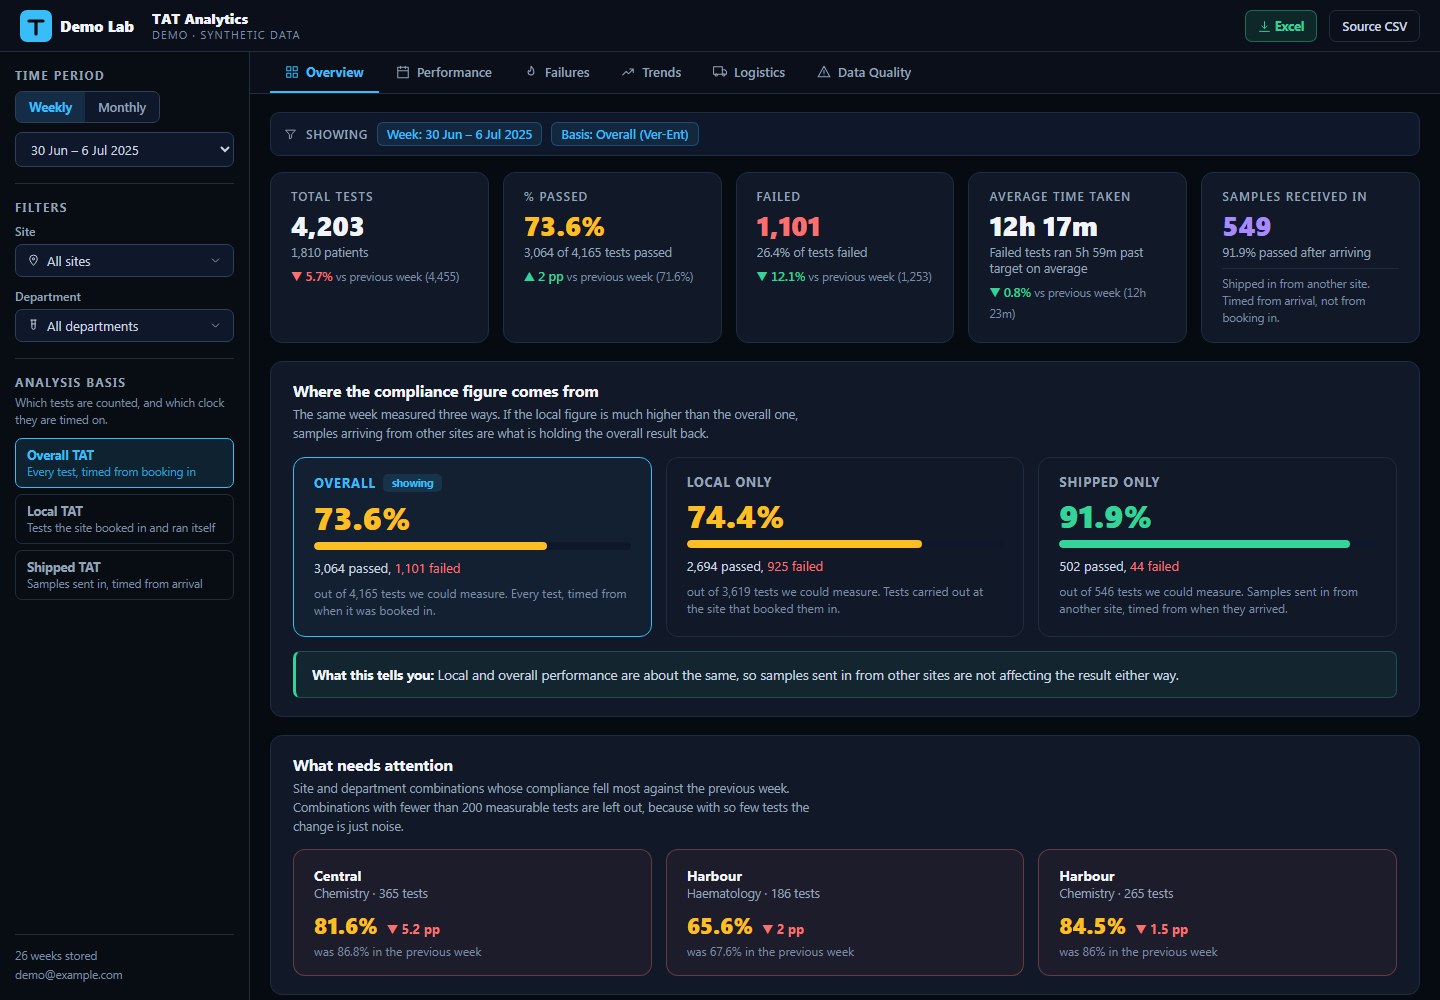
The overview page, shown here in the public demo running on made-up data. It shows how many tests were run, how many were on time, how late the late ones were, and which site and department combinations got worse this week.
What it means
Supervisors now open the dashboard on their daily operational calls. The question changed from “how did last week go?” to “what is happening right now, and where?” Across the network, the share of results delivered on time went from about 50% to over 70%.
For technical readers
React, Supabase (Postgres) with row-level security, Python and pandas for the first version, Excel